
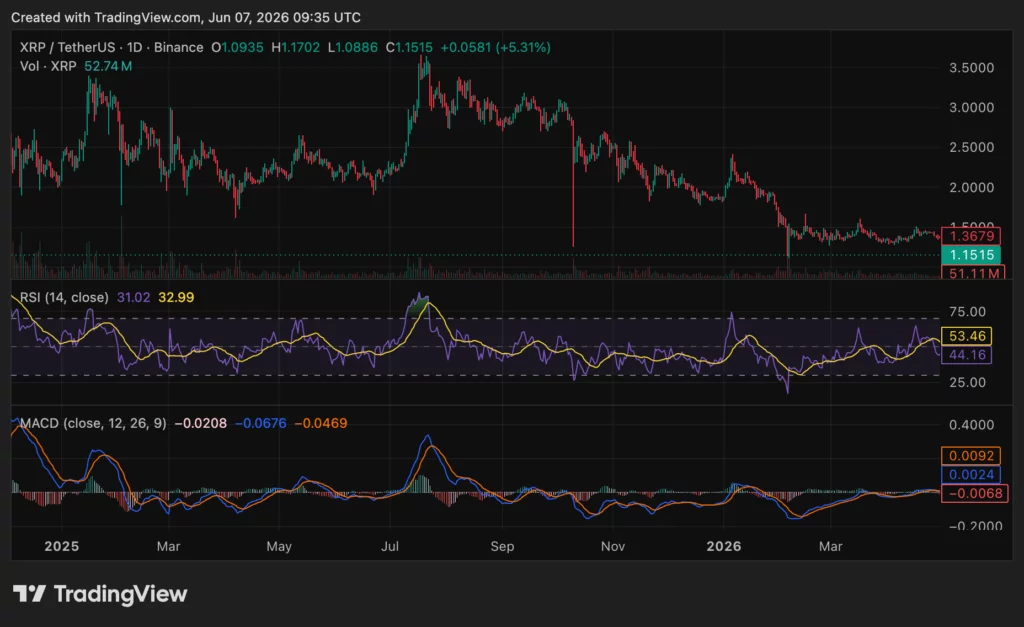
XRP traded near $1.16 on June 7 after a sharp weekly selloff pushed the token close to the $1.00 area. The move gave traders a short-term rebound, but the wider trend remains weak.
Summary
- XRP rebounded near $1.16, but weekly and monthly losses still show weak market structure.
- Egrag Crypto says XRP still follows his blue path, despite near-term support pressure.
- ETF inflows offer relief, but XRP needs $1.36 to confirm stronger upside momentum.
Crypto.news price data showed XRP gained about 6.21% in 24 hours, while it stayed down 12.8% over seven days and 16.16% over the past month. The token held a market cap near $72.19 billion and ranked sixth among crypto assets.
XRP price rebounds, but weekly losses remain heavy
XRP moved between $1.07 and $1.16 in the past 24 hours. The rebound helped price recover from the lower end of its daily range, but it did not erase the latest weekly damage.
The token also remained far below its July 18, 2025 all-time high of $3.65. Its one-year change stood at about minus 46.73%, while the 200-day change was near minus 45.86%.
This shows that XRP’s current bounce is still part of a larger downtrend. Buyers have returned near the $1.00 region, but they have not yet confirmed a trend change.
Crypto.news recently reported that XRP could revisit $1.03 without breaking its long-term structure. That level now acts as a key support zone for traders watching whether the rebound can hold.
Egrag Crypto says the blue path still matters
Egrag Crypto said XRP’s broader path still follows his earlier “blue” scenario. He argued that traders should not focus only on exact numbers, but also on structure, direction, liquidity behavior, and macro alignment.
“Markets are not about predicting exact numbers with perfection,” Egrag Crypto said.
The analyst added that XRP’s movement still respects the blue roadmap “almost perfectly.” His view places the current decline inside a larger technical path rather than treating it as a full breakdown.
Still, that view remains an analyst’s market reading, not a confirmed price outcome. XRP must hold support and recover key resistance levels before traders can treat the rebound as stronger.
The clearest upside level remains around $1.36. A move above that area would show stronger buying pressure and improve XRP’s short-term setup.
RSI and MACD show early recovery signs
XRP’s RSI sits around 44.16, while its moving average stands near 53.46. This shows momentum has improved from weaker levels, but XRP has not yet moved into a stronger buyer zone.
A move above 50 on the RSI would help confirm better momentum. Until then, sellers can still control the short-term trend.
The MACD also remains slightly bearish. The MACD line still sits below the signal line, but the histogram is close to neutral.
That means selling pressure is slowing, but XRP has not confirmed a full recovery signal. A bullish MACD crossover would give traders a stronger reason to watch for a move toward $1.36.
Volume also remains moderate at around 51 million to 52 million XRP. That shows the rebound is active, but not yet backed by a strong breakout in demand.
XRP ETF inflows offer relief during the selloff
XRP’s ETF market gave traders one positive data point during the recent decline. According to SoSoValue data, U.S. spot XRP ETFs ended the week with about $2.62 million in net inflows.
The weekly inflows were small, but they stood out because Bitcoin ETFs saw heavy withdrawals during the same period. XRP funds also recorded only one red day last week.
The funds’ cumulative flows reportedly reached more than $1.43 billion. Bitwise and Canary Capital remained among the leading XRP ETF issuers by assets.
This ETF activity does not remove XRP’s price risk. However, it shows that some institutional demand remained active during a weak week for the broader crypto market.
Crypto.news also reported earlier that U.S. spot XRP ETFs posted $25.8 million in one day in May, their strongest daily inflow in four months.
Dominance breakdown keeps downside risk alive
ChartNerdTA said XRP dominance has broken down after two confirmed contacts with a seven-year resistance trendline. The analyst also noted a loss of triangle support.
“Dominance currently sits at 3.3%,” ChartNerdTA said, adding that historical support sits near 1.1% if underperformance continues.
This dominance chart adds caution to XRP’s price setup. Even if XRP rebounds in dollar terms, it may still lag the wider crypto market if dominance keeps falling.
The main downside level remains $1.03, followed by the $1.00 psychological area. A clean break below both levels could raise pressure toward lower support.
On the upside, XRP needs to reclaim $1.36 with higher volume. That would give buyers a clearer signal that the latest rebound has more strength.
For now, XRP is trying to recover after a heavy drop. The token has ETF support and early momentum repair, but the chart still needs stronger confirmation.
Disclosure: This article does not represent investment advice. The content and materials featured on this page are for educational purposes only.